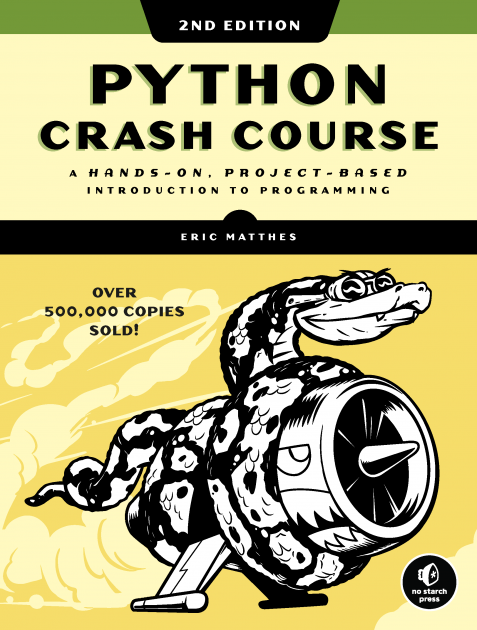
I was introduced to the Python Programming language after being exposed to C++, Java, and PHP. I enjoyed the simplicity of the language for an introductory language, and it requires fewer symbols and braces. I studied Introduction to Computer Programming at Wake Tech in Raleigh, North Carolina. I was immediately intrigued because the teacher was more into the programming language than my Java teacher at the time. The teacher's enthusiasm made me put forth more effort in learning the language to pass. As I got closer to the end of the semester, I decided to continue learning Python on my own and did some research on different books that I could use to teach myself. I knew my skill level wasn't high, so I looked for books geared to beginners that helped to transition intermediate level programmers, and got lucky when I found Crash Course Python: A Hands-on Project-Based Introduction to Programming.
Since I was shopping and researching online, I was judging a book by its cover, and I am glad that I decided on this book. It starts at the basics for the first eleven chapters to get the reader/coder familiarized with Python and understand the importance of knowing the environment, the language packages, and some of Python's nuances before going into the three major projects that explain some of the strengths behind Python. The second project section of the book, Data Visualization, was the section that grabbed my attention and allowed me to do more personal investigation and research into some of the libraries that have been created for Python. The Matplotlib python library is utilized to develop the different visuals from the various exercises covered in the book. My favorite three were the Random Walk, Github Analysis chart(s), and the US/World Population graphics.

Random Walks
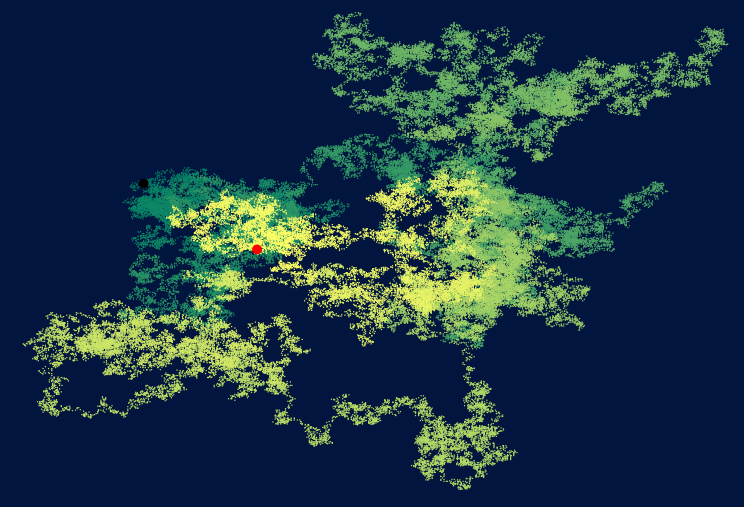
The Random Walk section of the book is used to create random scatter plots or line segments to simulate spontaneous movement. The idea is that this type of programming might be able to simulate either molecular movement or the movement of a single speck of pollen on a drop of water or dew. While doing the initial coding of this section, I noticed different aspects of the code that I could alter and personalized. I looked up the documentation for using the Matplotlib library to adjust the color spectrum of the various points and change the background from the system default colors.
The image below is an example of the alterations that I made by
researching through the documentation of Matplotlib by changing the cmap
property from the default blue color to the "summer" color scheme. To
alter the graphs' background color, I found the "set_facecolor" method
and used the hexadecimal value to set the background color to
#1f0954 , the equivalent to dark indigo. A
great site that allows for the using a set of colors for the background
is on
W3Schools. I left in the indicators for the first and last plot points to
demonstrate the points' random motion. The change in shade and hue of
the points goes from darker to lighter as the program progresses.

Rolling Dice
I created a program that used the concepts discussed in this book and
other concepts that I researched while creating other applications. This
program allows the user to enter an integer value and simulates rolling
dice the user's number of times. Each roll is saved into a list. The
list is then analyzed for individual count occurrences, and the count is
kept in an array to be used by a function that graphs the results in a
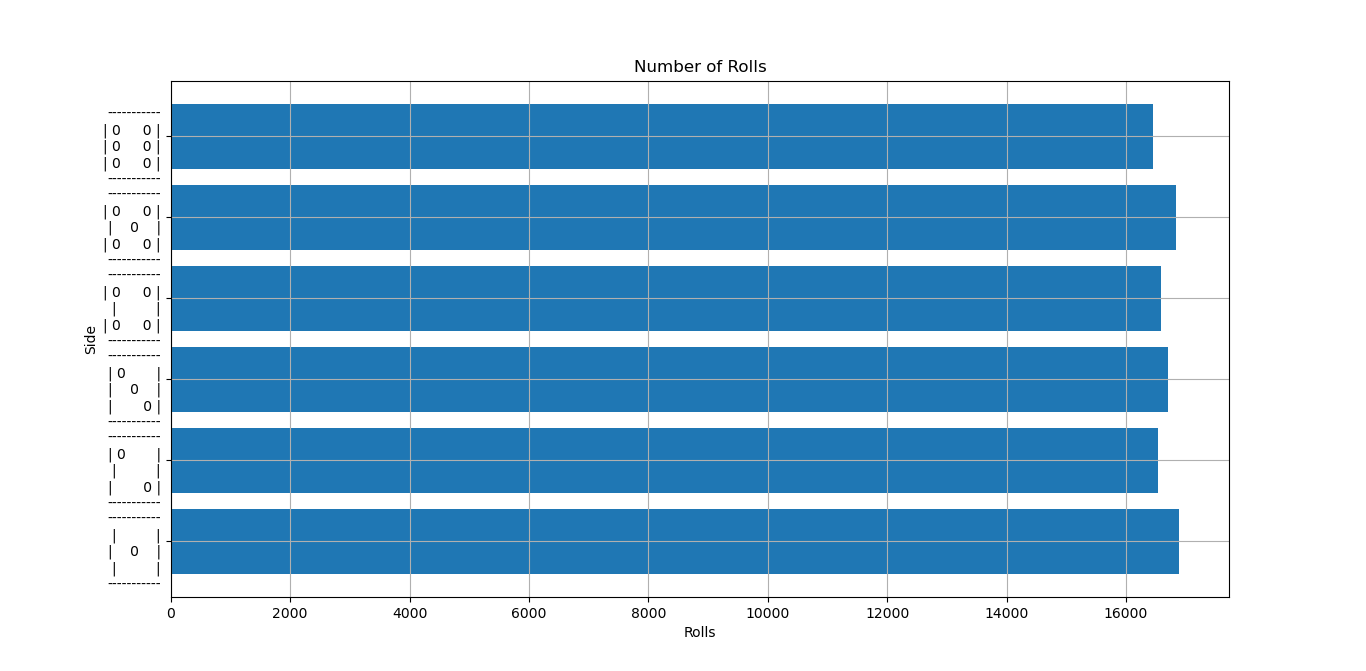
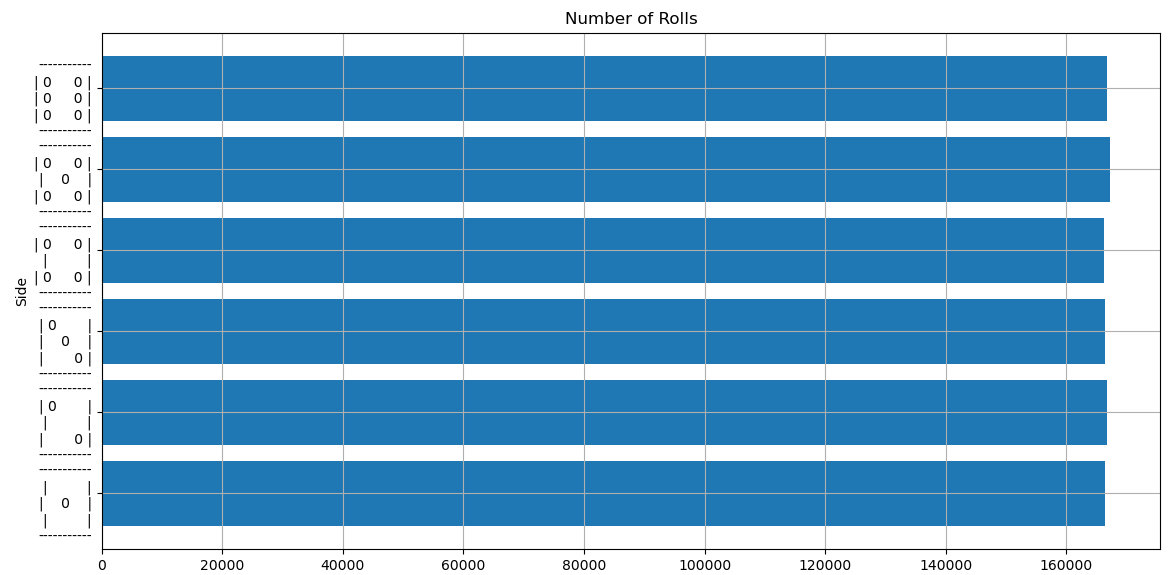
horizontal bar graph using the Matplotlib module. The
program also uses the random module to roll the dice.

I wanted a graphical representation that showed that the odds of getting any given side are equal with enough trials. The above graph shows a simulation of 100,000 rolls, and the below chart is a representation of 1,000,000 rolls. I designed simulated faces of the die to be the representation on the graph for ease of viewing.
